Circuit boards data
circuit.RdNumber of nonconformities observed in 26 successive samples of 100 printed circuit boards. Sample 6 and 20 are outside the control limits. Sample 6 was examined by a new inspector and he did not recognize several type of nonconformities that could have been present. Furthermore, the unusually large number of nonconformities in sample 20 resulted from a temperature control problem in the wave soldering machine, which was subsequently repaired. The last 20 samples are further samples collected on inspection units (each formed by 100 boards).
Usage
data(circuit)Format
A data frame with 46 observations on the following 4 variables.
- sample
sample number
- x
number of defectives in 100 printed circuit boards (inspection unit)
- size
sample size
- trial
trial sample indicator (TRUE/FALSE)
References
Montgomery, D.C. (1991) Introduction to Statistical Quality Control, 2nd ed, New York, John Wiley & Sons, pp. 173–175
Examples
data(circuit)
describe(circuit, by = trial)
#> ── trial = FALSE ───────────────────────────────────────────────────────────────
#> Obs Mean StdDev Min Median Max
#> sample 20 36.5 5.916 27 36.5 46
#> x 20 18.3 4.714 9 18.5 28
#> size 20 100.0 0.000 100 100.0 100
#>
#> ── trial = TRUE ────────────────────────────────────────────────────────────────
#> Obs Mean StdDev Min Median Max
#> sample 26 13.50 7.649 1 13.5 26
#> x 26 19.85 7.165 5 19.0 39
#> size 26 100.00 0.000 100 100.0 100
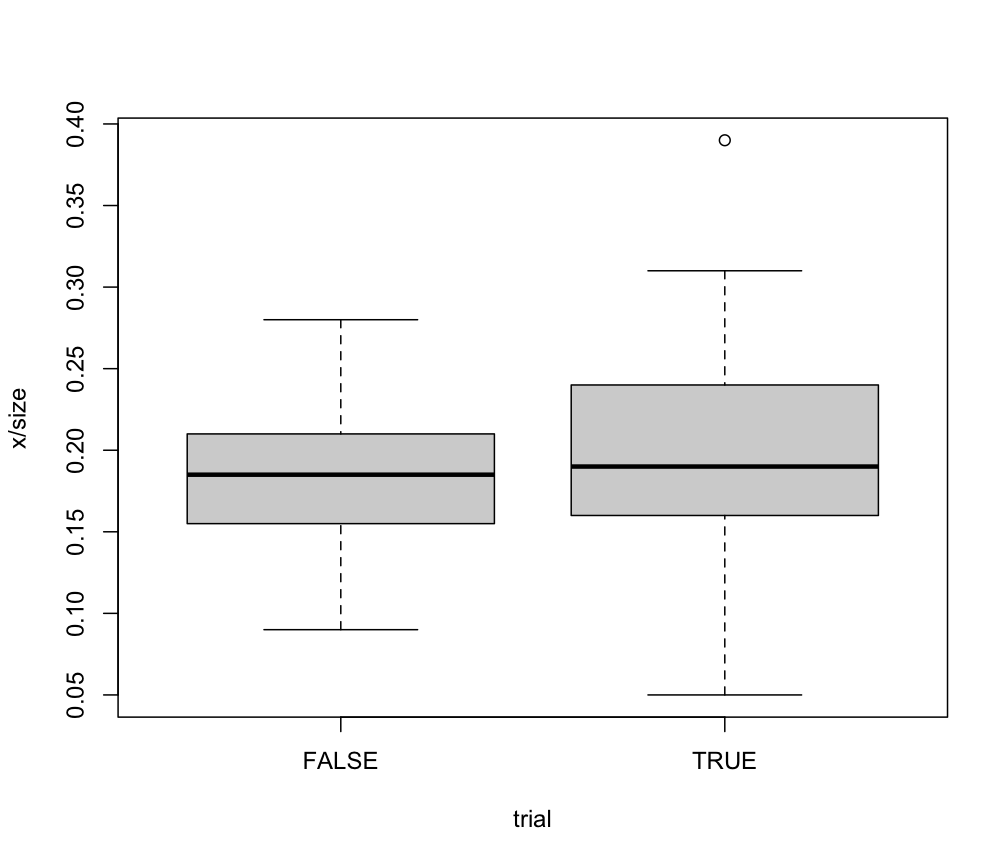
boxplot(x/size ~ trial, data = circuit)
 plot(x/size ~ sample, data = circuit, type="b")
