Pareto chart
paretoChart.RdComputes a table of statistics and plot a Pareto chart.
Usage
paretoChart(data, ...)

# S3 method for class 'paretoChart'
plot(x, title, xlab,
     ylab = "Frequency", ylab2 = "Cumulative percentage",
     ylim, col = blues.colors(nlevels), ...)
Arguments
- data
a vector of values.
names(data)are used for labelling the bars.- plot
a logical specifying if the chart should be provided (
TRUE, default).- x
an object of class
'paretoChart'returned by a call toparetoChart()function.- title
a character string specifying the main title. Set
title = NULLto remove the title.- xlab
a string specifying the label for the x-axis.
- ylab
a string specifying the label for the y-axis.
- ylab2
a string specifying the label for the second y-axis on the right side.
- ylim
a numeric vector specifying the limits for the y-axis.
- col
a value for the color, a vector of colors, or a palette for the bars. See the help for
colorsandpalette.- ...
catch other optional arguments.
Value
Returns an object of class 'paretoChart' containing the descriptive statistics used to draw the Pareto chart. This object has associated a print and plot method.
Details
A Pareto chart is a barplot where the categories are ordered in non increasing order, and a line is also added to show the cumulative sum.
References
Mason, R.L. and Young, J.C. (2002) Multivariate Statistical Process Control with Industrial Applications, SIAM.
Montgomery, D.C. (2013) Introduction to Statistical Quality Control, 7th ed. New York: John Wiley & Sons.
Ryan, T. P. (2011), Statistical Methods for Quality Improvement, 3rd ed. New York: John Wiley & Sons, Inc.
Scrucca, L. (2004). qcc: an R package for quality control charting and statistical process control. R News 4/1, 11-17.
Wetherill, G.B. and Brown, D.W. (1991) Statistical Process Control. New York: Chapman & Hall.
Examples
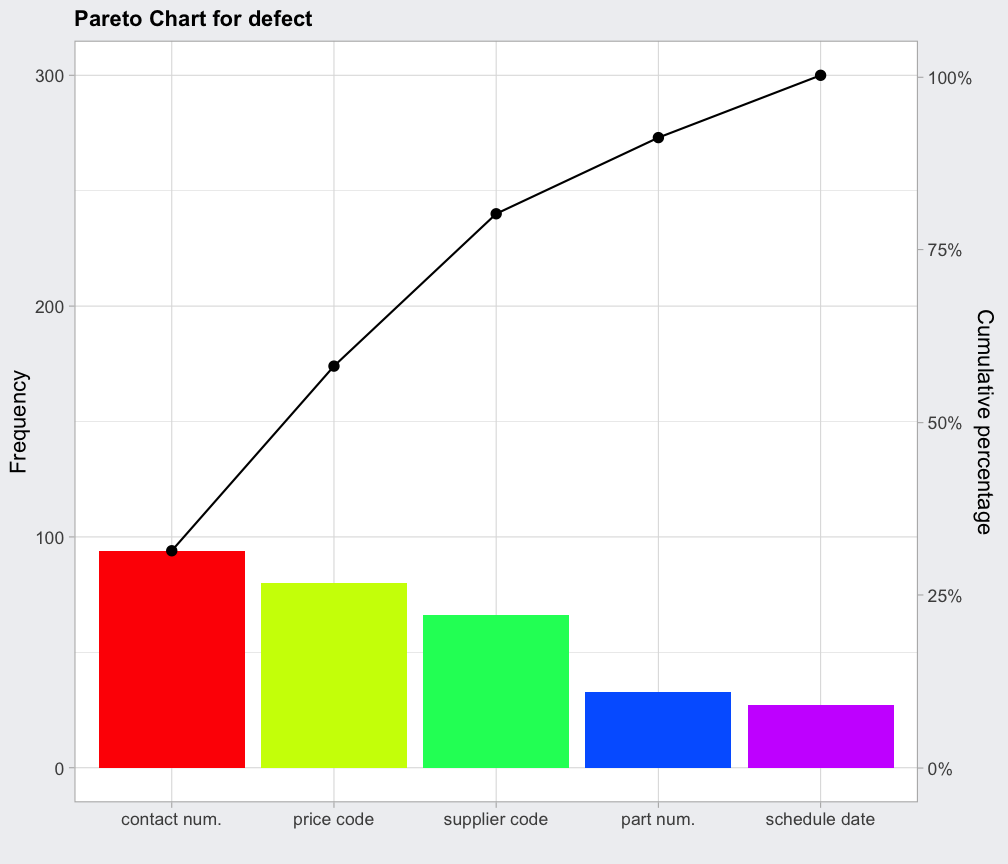
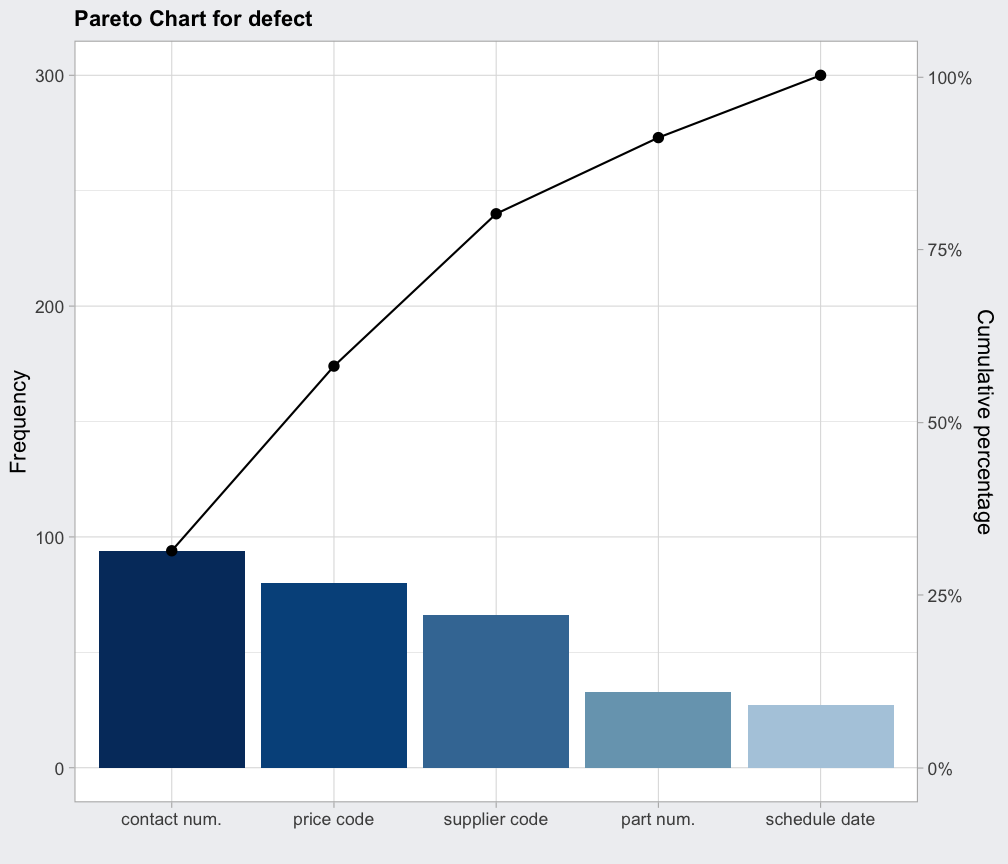
defect  = c(80, 27, 66, 94, 33)
names(defect)  = c("price code", "schedule date", "supplier code", "contact num.", "part num.")
pc = paretoChart(defect, ylab = "Error frequency")
pc
#> ── Pareto Chart ──────────────────────────────────
#>
#> defect          Frequency Cum.Freq. Percentage Cum.Percent.
#>   contact num.         94        94      31.33        31.33
#>   price code           80       174      26.67        58.00
#>   supplier code        66       240      22.00        80.00
#>   part num.            33       273      11.00        91.00
#>   schedule date        27       300       9.00       100.00
plot(pc)


plot(paretoChart(defect, ylab = "Error frequency"), col=rainbow(length(defect)))