Process capability analysis
processCapability.RdComputes process capability indices for a 'qcc' object of type "xbar" and plot the histogram.
Usage
processCapability(object, spec.limits, target,
                  std.dev, nsigmas,
                  confidence.level = 0.95,  ...)

# S3 method for class 'processCapability'
print(x, digits = getOption("digits"), ...)

# S3 method for class 'processCapability'
plot(x,
     add.stats = qcc.options("add.stats"),
     breaks = nclass.hist,
     fill = adjustcolor(qcc.options("zones")$fill, alpha.f = 0.5),
     color = "white", title, xlab,
     digits = getOption("digits"), ...)
Arguments
- object
a
'qcc'object of type"xbar"- spec.limits
a two-values vector specifying the lower and upper specification limits. For one-sided specification limits, the value of the missing limit must be set to
NA.- target
a value specifying the target of the process. If missing the value from the
'qcc'object is used if notNULL, otherwise the target is set at the middle value between specification limits.- std.dev
a value specifying the within-group standard deviation. If not provided is taken from the
'qcc'object.- nsigmas
a numeric value specifying the number of sigmas to use. If not provided is taken from the
'qcc'object.- confidence.level
a numeric value between 0 and 1 specifying the level to use for computing confidence intervals.
- x
an object of class
'processCapability'.- add.stats
a logical value indicating whether statistics and capability indices should be added at the bottom of the chart.
- breaks
a value or a function used to select the number of bins in a histogram. See the help for
nclass.scottfor more details.- fill, color
values specifying the colour of the filled area and the border used for drawing the histogram.
- title
a character string specifying the plot title. Set
title = NULLto remove the title.- xlab
a character string specifying the label for the x-axis.
- digits
the number of significant digits to use.
- ...
catches further ignored arguments.
Details
This function calculates confidence limits for \(C_p\) using the method described by Chou et al. (1990). Approximate confidence limits for \(C_{pl}\), \(C_{pu}\) and \(C_{pk}\) are computed using the method in Bissell (1990). Confidence limits for \(C_{pm}\) are based on the method of Boyles (1991); this method is approximate and it assumes that the target is midway between the specification limits.
Value
Invisibly returns a list with components:
- nobs
number of observations
- center
center
- std.dev
standard deviation
- target
target
- spec.limits
a vector of values giving the lower specification limit (LSL) and the upper specification limit (USL)
- indices
a matrix of capability indices (\(C_p\), \(C_{pl}\), \(C_{pu}\), \(C_{pk}\), \(C_{pm}\)) and the corresponding confidence limits.
- exp
a vector of values giving the expected fraction, based on a normal approximation, of the observations less than LSL and greater than USL.
- obs
a vector of values giving the fraction of observations less than LSL and greater than USL.
References
Bissell, A.F. (1990) How reliable is your capability index?, Applied Statistics, 39, 331-340.
Boyles, R.A. (1991) The Taguchi capability index, Journal of Quality Technology, 23, 107-126.
Chou, Y., Owen D.B. and Borrego S.A. (1990) Lower Confidence Limits on Process Capability Indices, Journal of Quality Technology, 22, 223-229.
Montgomery, D.C. (2013) Introduction to Statistical Quality Control, 7th ed. New York: John Wiley & Sons.
Wetherill, G.B. and Brown, D.W. (1991) Statistical Process Control. New York: Chapman & Hall.
Examples
data(pistonrings)
diameter = qccGroups(data = pistonrings, diameter, sample)
q = qcc(diameter[1:25,], type="xbar", nsigmas=3)
pc = processCapability(q, spec.limits=c(73.95,74.05))
pc
#> ── Process Capability Analysis ───────────────────
#>
#> Number of obs = 125 Target = 74
#> Center = 74.00118 LSL = 73.95
#> StdDev = 0.009785039 USL = 74.05
#>
#> Capability indices Value 2.5% 97.5%
#> Cp 1.70 1.49 1.91
#> Cp_l 1.74 1.55 1.93
#> Cp_u 1.66 1.48 1.84
#> Cp_k 1.66 1.45 1.88
#> Cpm 1.69 1.48 1.90
#>
#> Exp<LSL 0% Obs<LSL 0%
#> Exp>USL 0% Obs>USL 0%
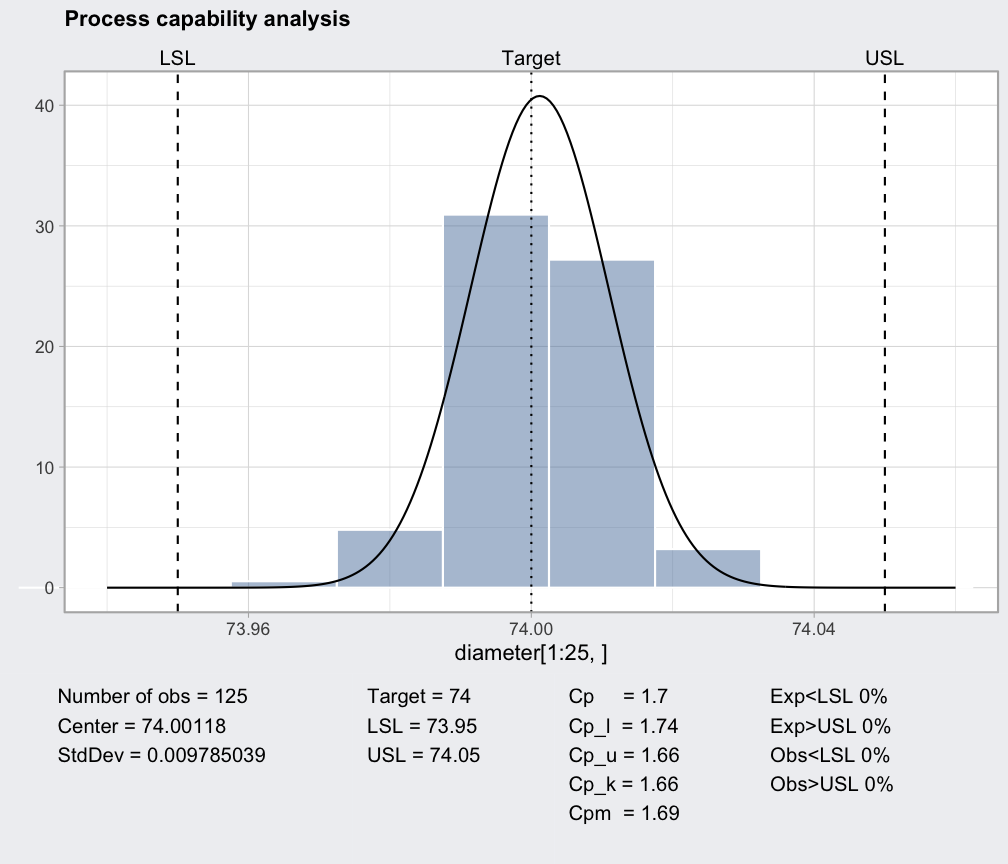
plot(pc)
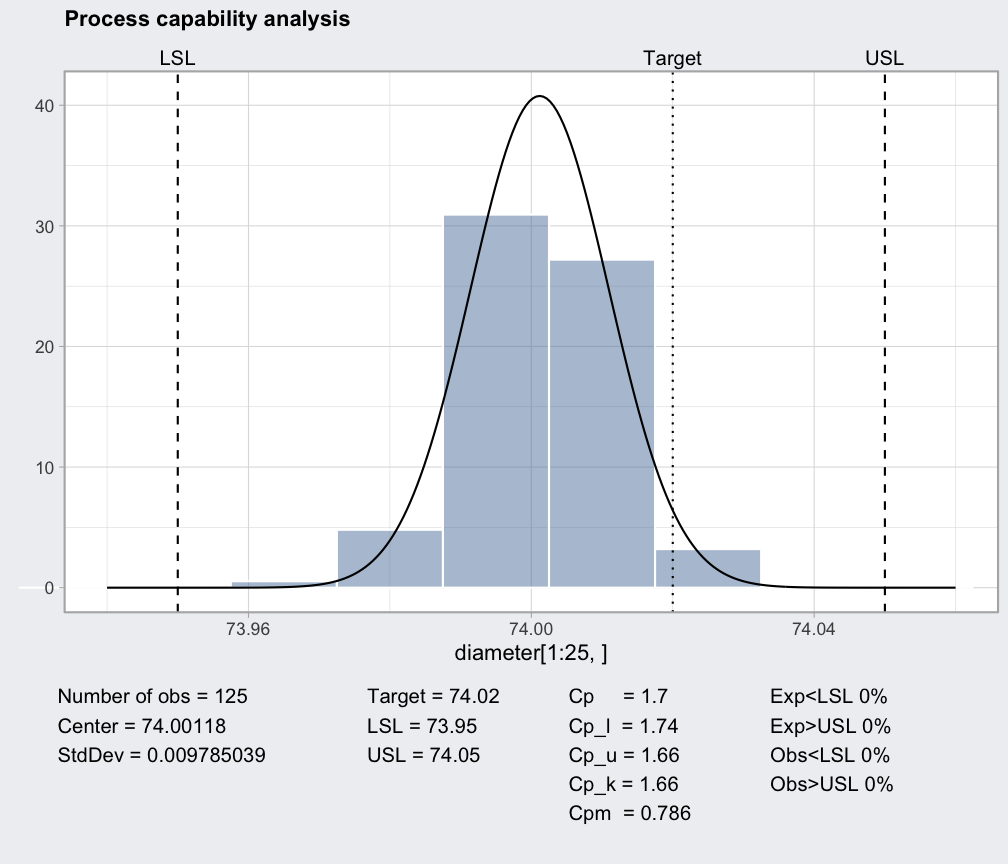
 plot(processCapability(q, spec.limits=c(73.95,74.05), target=74.02))
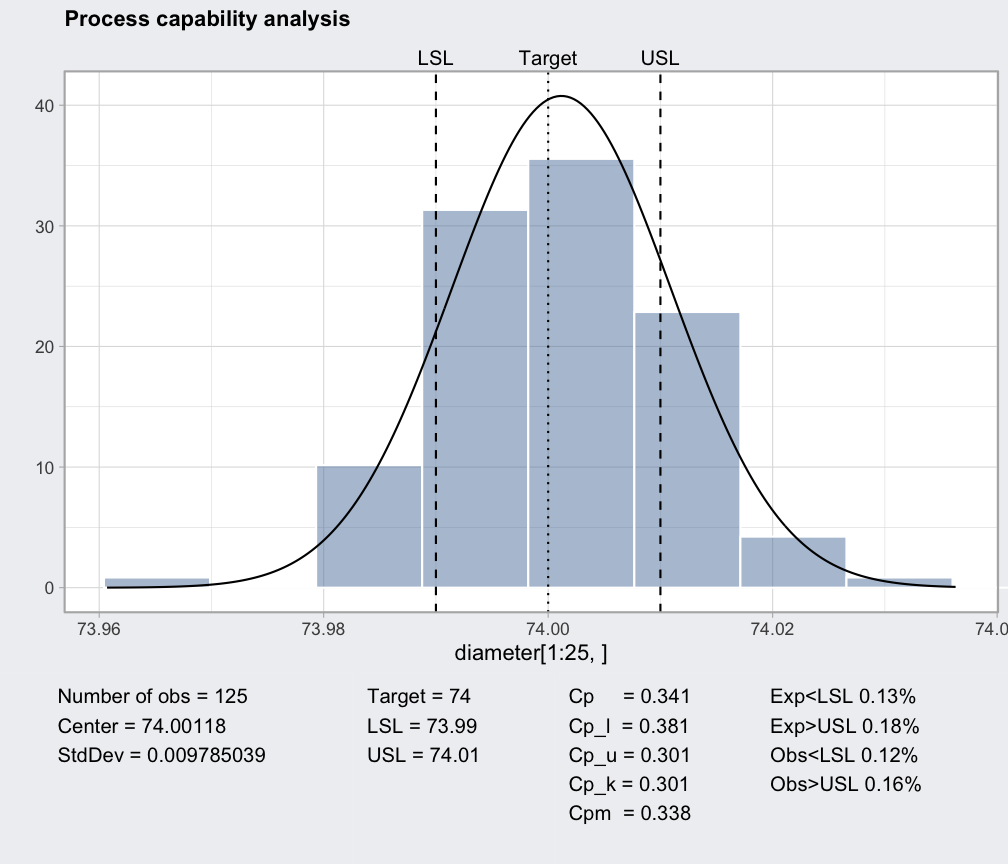
 plot(processCapability(q, spec.limits=c(73.99,74.01)))
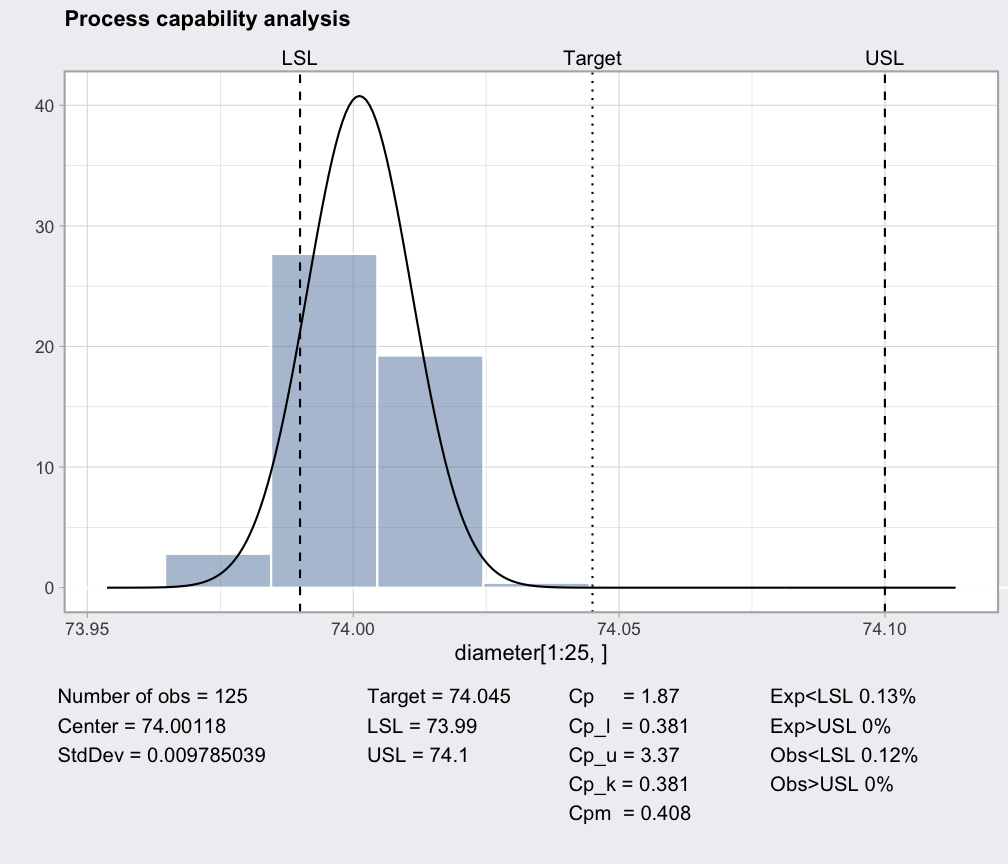
 plot(processCapability(q, spec.limits = c(73.99, 74.1)))